Our website is not supported on this browser
The browser you are using (Internet Explorer) cannot display our content.
Please come back on a more recent browser to have the best experience possible

Testing is on the critical path for getting a vehicle ready for launch. Typically, several concurrent vehicles are in development, with some taking months to test. To ensure that products launch safely and on time, automakers manage their testing cycles very closely.
As demand rises for features like connectivity and adaptive cruise control, so has the number of components and software. In turn, the number of tests conducted has risen exponentially.
Our client, a global automotive OEM, runs several testing labs in R&D to accommodate the sheer volume of tests. Their labs operated separately with unaligned KPIs and targets. Large amounts of testing data were gathered without common structure.
Unfortunately, the result was that the test labs were not performing to targets. True testing performance was hidden, and inputs suffered from low confidence.
Our client lacked visibility into key performance metrics and insights into test delays or failures. The resulting issues were testing inefficiency, scheduling delays, and low lab utilization. To keep vehicle launches on track, our client spent millions on outsourced testing costs each year.
After a new executive leadership team assembled, they asked us how they could use their data in order to:
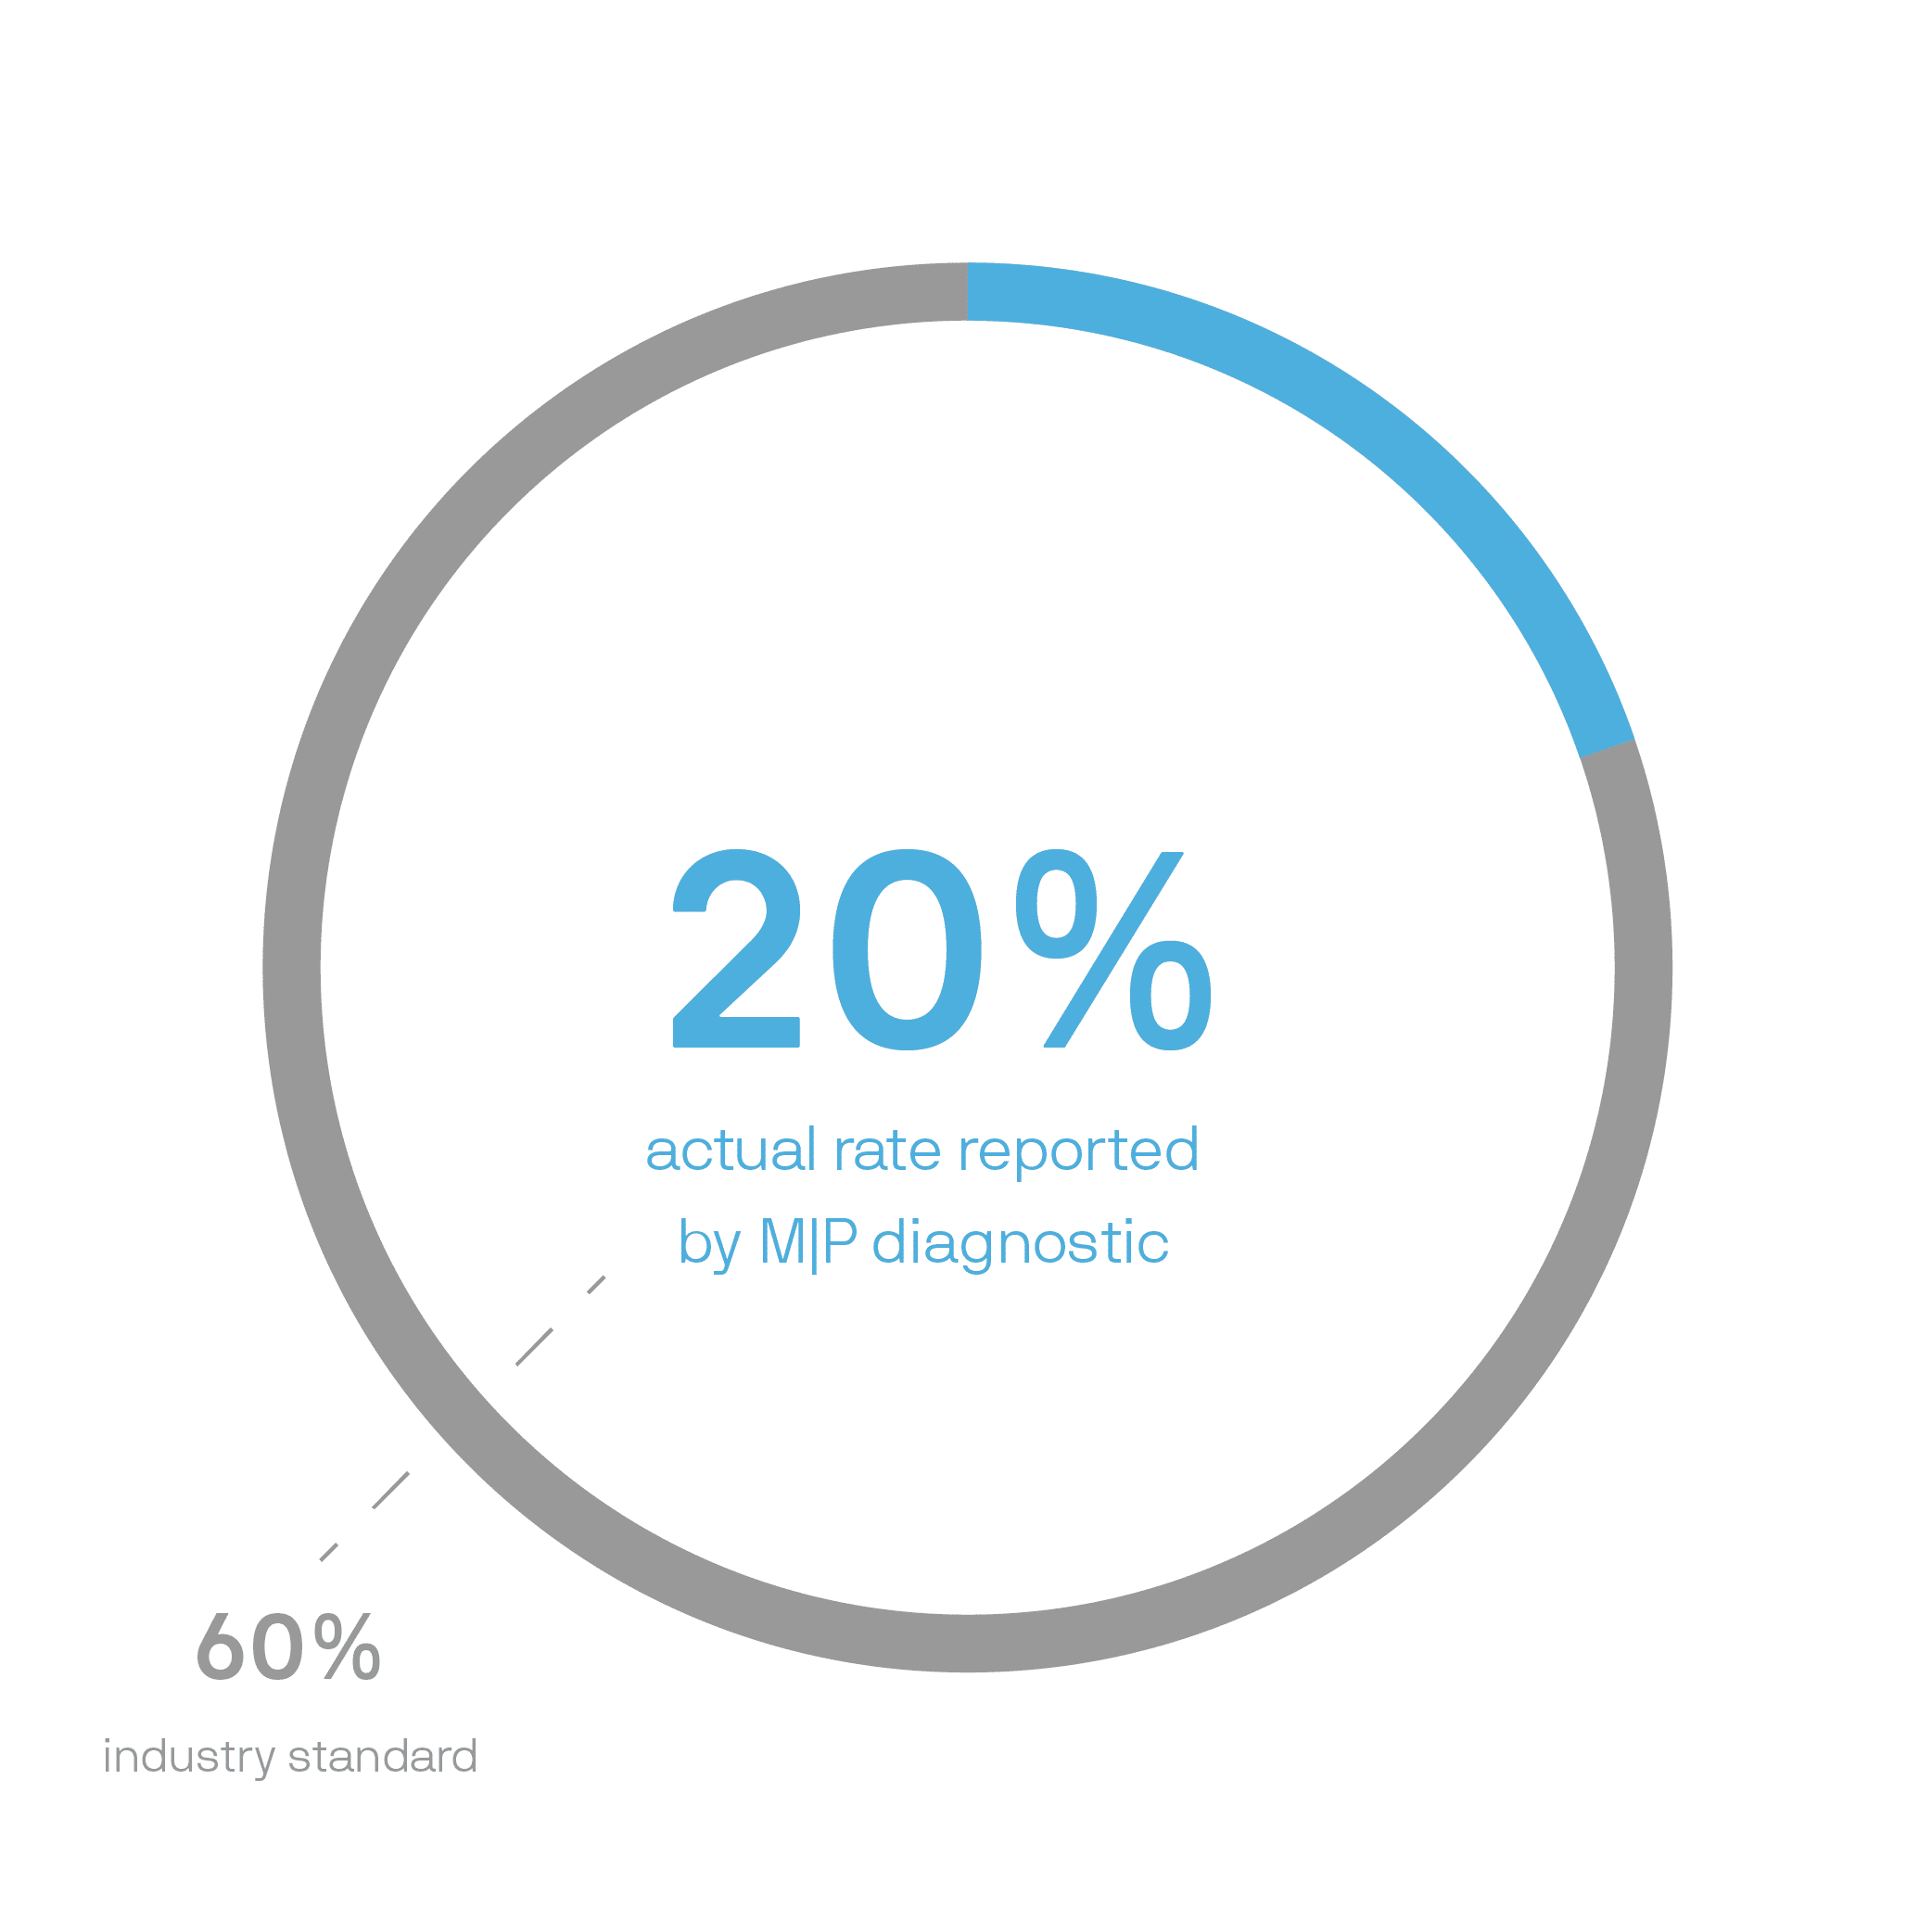
To start, our team completed a diagnostic to understand the current state of the labs. Historically, the various labs had been reporting utilization rates of over 90%. This number seemed unusually high given our prior engagements. A more realistic rate is around 60%. So, on paper, they were running at a high rate.
However, when comparing those rates to the need for outsourcing, the client realized those utilization rates couldn’t be accurate. They assigned MIGSO-PCUBED the task of changing how utilization was calculated to get a realistic number.
After we implemented intentional KPI tracking across the labs, the results from the project dashboards reflected the accurate assessment. Our Digital Dashboard uncovered that the actual utilization was below 20%.

In response to the results, the client reenlisted MP to:

To meet their utilization goal, MIGSO-PCUBED deployed an Agile team of consultants to develop an analytical project status dashboard. By organizing sprints, we made incremental improvements to get the client on track. The challenges that the team tackled were:
The project management dashboard development process began with the team gathering feedback. Key stakeholders at all levels of the organization participated in interviews and test case analyses. This stage was crucial to align to our clients’ processes and business needs.
Next, the team leveraged those insights and developed a proof of concept. This dashboard was composed of mission critical metrics and tracking KPIs. The team automated updates from primary data points multiple times per day.
Read another case study: Increasing Time to Engineer by Simplifying Data and Decisions with Microsoft Power Platform

To pull this off, our consultants used Alteryx for data analytics and QlikView for data visualization. The reason for this was because the client was familiar with them in many ways. As they’re widely known industry tools, the platforms were already part of the client’s IT suite. This allowed us to realize the true project data while providing data analysis in a format the client was used to.
“The way that we can connect and get real time data, like the method to actually extract the data, matters, and the data architecture behind it, matters,” said Adysti Kardi, a consultant working on the engagement. “For us to design a good dashboard, we need to try and put ourselves in the user’s shoes to understand: What are the key decisions that they’re trying to make? To understand how we are going to design the charts and the user interface based on how the users will interpret this data and make decisions.”
Finally, after development, the team piloted the KPI dashboard with operational personnel and the executive team. They integrated user feedback into further releases, using predictive analytics and delivering on continuous improvement. With each dashboard release, more teams used the dashboard, and executives had a better overview of operations.
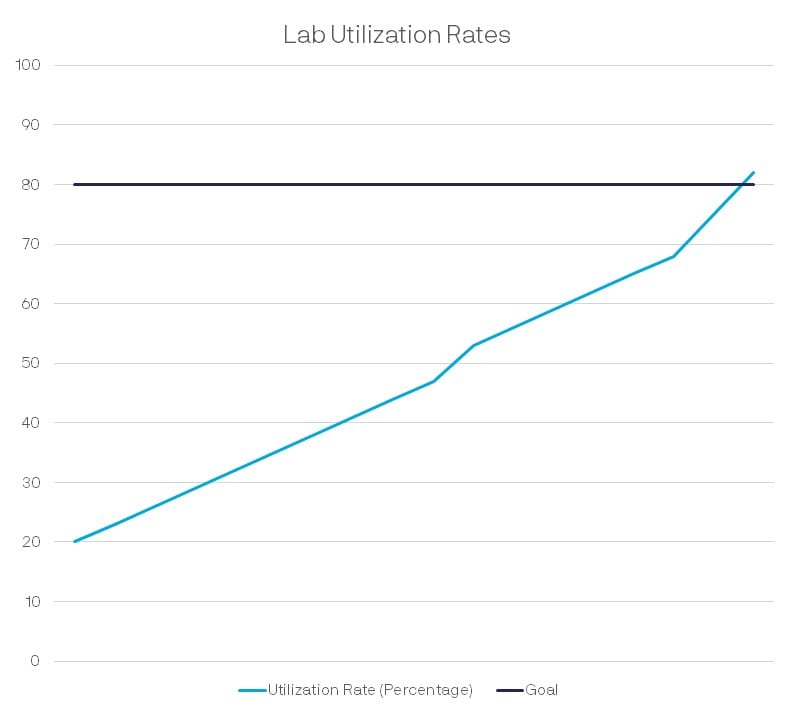
In the 18 months since the dashboard’s deployment, utilization has increased across all the labs. Lab management can now act quickly to resolve testing delays. With clean data on utilization rates, the client can forecast testing more accurately. Ultimately, they can keep it in house to save on outsourcing costs.

The resulting product was originally intended as an executive management dashboard. However, we expanded its reach to over 200 users from the executive suite to the shop floor. Now, stakeholders all have:
“As I pitched the 2021 plan to my upper management, I emphasized and totally believe this program is the centerpiece in modernizing our data gathering, communicating our efficiency, and identifying our areas for efficiency gain,” said the Executive Sponsor. “I’m very pleased and thankful to see the team’s engagement.”
This article was written by: Anthony Veltri, Michael Tolomei, and Miriam Schmitz.
Loved what you just read?
Let's stay in touch.
No spam, only great things to read in our newsletter.
We combine our expertise with a fine knowledge of the industry to deliver high-value project management services.
MIGSO-PCUBED is part of the ALTEN group.
Find us around the world
Australia – Canada – France – Germany – Italy – Mexico – The Netherlands – Portugal – Romania – South East Asia – Spain – Switzerland – United Kingdom – United States
© 2024 MIGSO-PCUBED. All rights reserved | Legal information | Privacy Policy | Cookie Settings | Intranet
Perfect jobs also result from great environments : the team, its culture and energy.
So tell us more about you : who you are, your project, your ambitions,
and let’s find your next step together.
Dear candidates, please note that you will only be contacted via email from the following domain: migso-pcubed.com. Please remain vigilant and ensure that you interact exclusively with our official websites. The MIGSO-PCUBED Team
Choose your language
Our website is not supported on this browser
The browser you are using (Internet Explorer) cannot display our content.
Please come back on a more recent browser to have the best experience possible
